
|
air tightness of existing UK housing stock
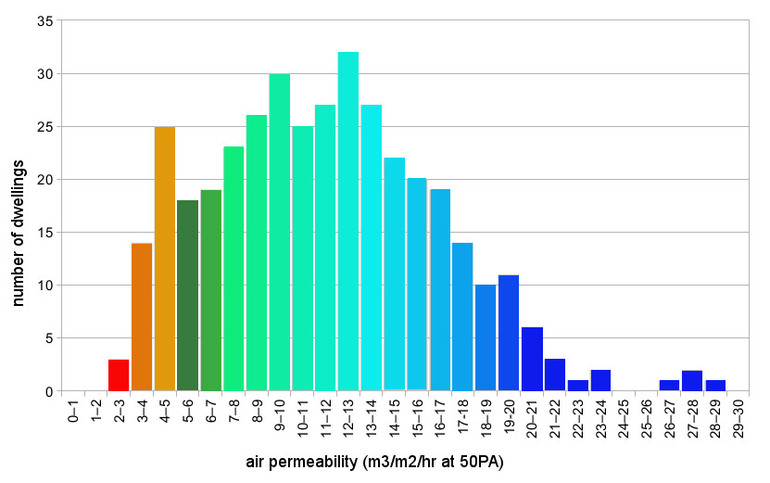
GRAPH SHOWING A SAMPLE OF AIR LEAKAGE RATES IN EXISTING HOUSES
The Building Research Establishment database contains air leakage results for 471 dwellings of different ages, construction, types and sizes. The Building Regulations state that any dwelling with an air leakage rate below 3 must have whole house mechanical ventilation as they are too air tight. Naturally ventilated dwellings that use windows and trickle vents should have an air leakage rate above 5. New dwellings should not have air leakage rates much above 7 as the dwellings will become increasingly more expensive to heat. For air leakage rates over 20, insulation probably makes no difference.
mean air leakage against year of construction
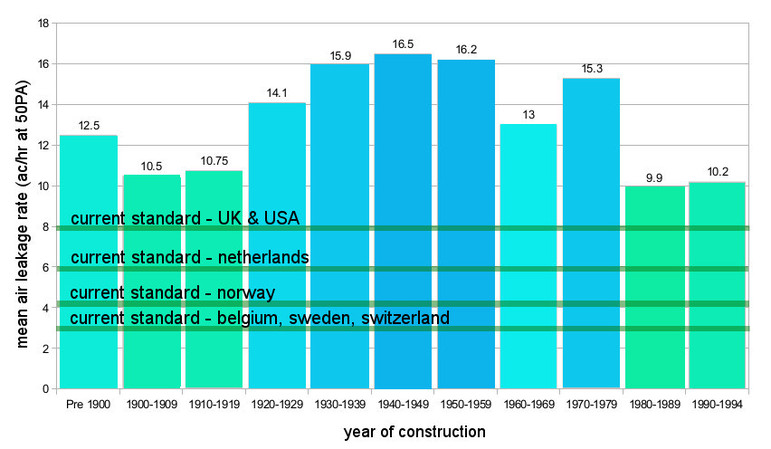
This chart gives a rough guide of the air tightness of your dwelling based on the year of construction.
Please note that air infiltration (the chart above) is different to air permeability (the top chart). Air infiltration takes account of air permeability, outside temperature, wind, heating & ventilation. where derry is against the average £50 basketball
|
each basketball is an average £50 on your heating bill

total number of basketball size holes against air permeability


|
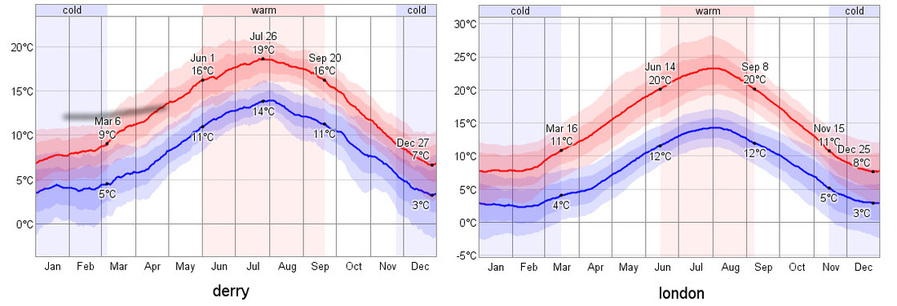
The above charts show average temperatures for Derry and London.
Derry has 4 months with average temperatures above 16°C and 4 months with average temperatures below 9°C.
London has 6 months with average temperatures above 16°C and 3 months with average temperatures above 9°C.
Derry has a heating season of 8 months compared to 6 months for London.
Derry has 4 months with average temperatures above 16°C and 4 months with average temperatures below 9°C.
London has 6 months with average temperatures above 16°C and 3 months with average temperatures above 9°C.
Derry has a heating season of 8 months compared to 6 months for London.
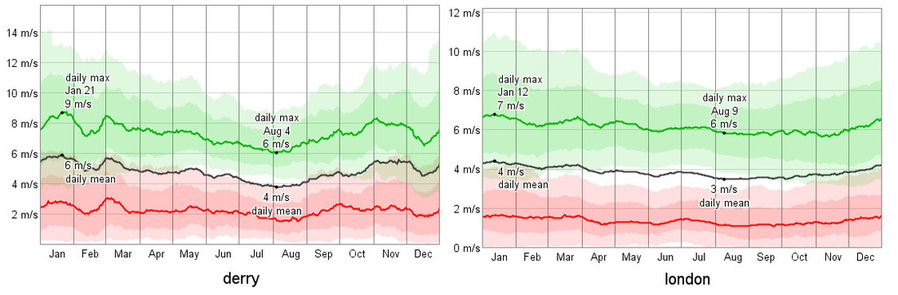
The above charts show average wind speeds for Derry and London.
Derry has average wind speeds between 6 and 4m/s. London has average wind speeds between 4 and 3m/s.
Derry has average wind speeds up to 50% higher than London.
Research shows that a windtight wall subject to wind speeds above 2.5m/s will suffer a 10% drop in thermal performance.
However a non-windtight wall, with cracks and gaps, will suffer a drop in thermal performance of 40%.
Derry is subject to a longer heating season and higher wind speeds than the UK average therefore the £50 cost for each basketball size for gaps and cracks will be alot higher.